
If you are running Performance Max campaigns for your ecommerce store, there is a report hiding inside Google Ads that most advertisers either don't know exists or have no idea how to read.
It's called the Channel Performance Report.
And it tells you something that the main campaign view never will: exactly where Google is spending your money across every channel in the network, and what return on ad spend each channel is delivering. Shopping, Search, YouTube, Display, Gmail, Maps; it's all broken down in there.
Today I'm walking you through how to find it, how to read it correctly, which columns actually matter, and how to use this data to make smarter decisions about your PMax campaigns.
How To Find The Channel Performance Report
First, click into a PMax campaign. I recommend picking whichever PMax campaign is spending the most, as that's usually where the highest leverage can be found.
Once you're inside the campaign, navigate to Insights and Reports. Scroll down and you'll find Channel Performance. That's the report we need.
Before you start analysing anything, make sure you've selected a decent date range. A couple of days won't give you statistically significant data. I'd recommend at least 30 days, but ideally longer if you have the history.
What To Ignore (And What Actually Matters)
When the report loads, you'll see your top-level campaign results at the top, but there's nothing particularly useful there that you can't already see at the campaign level.
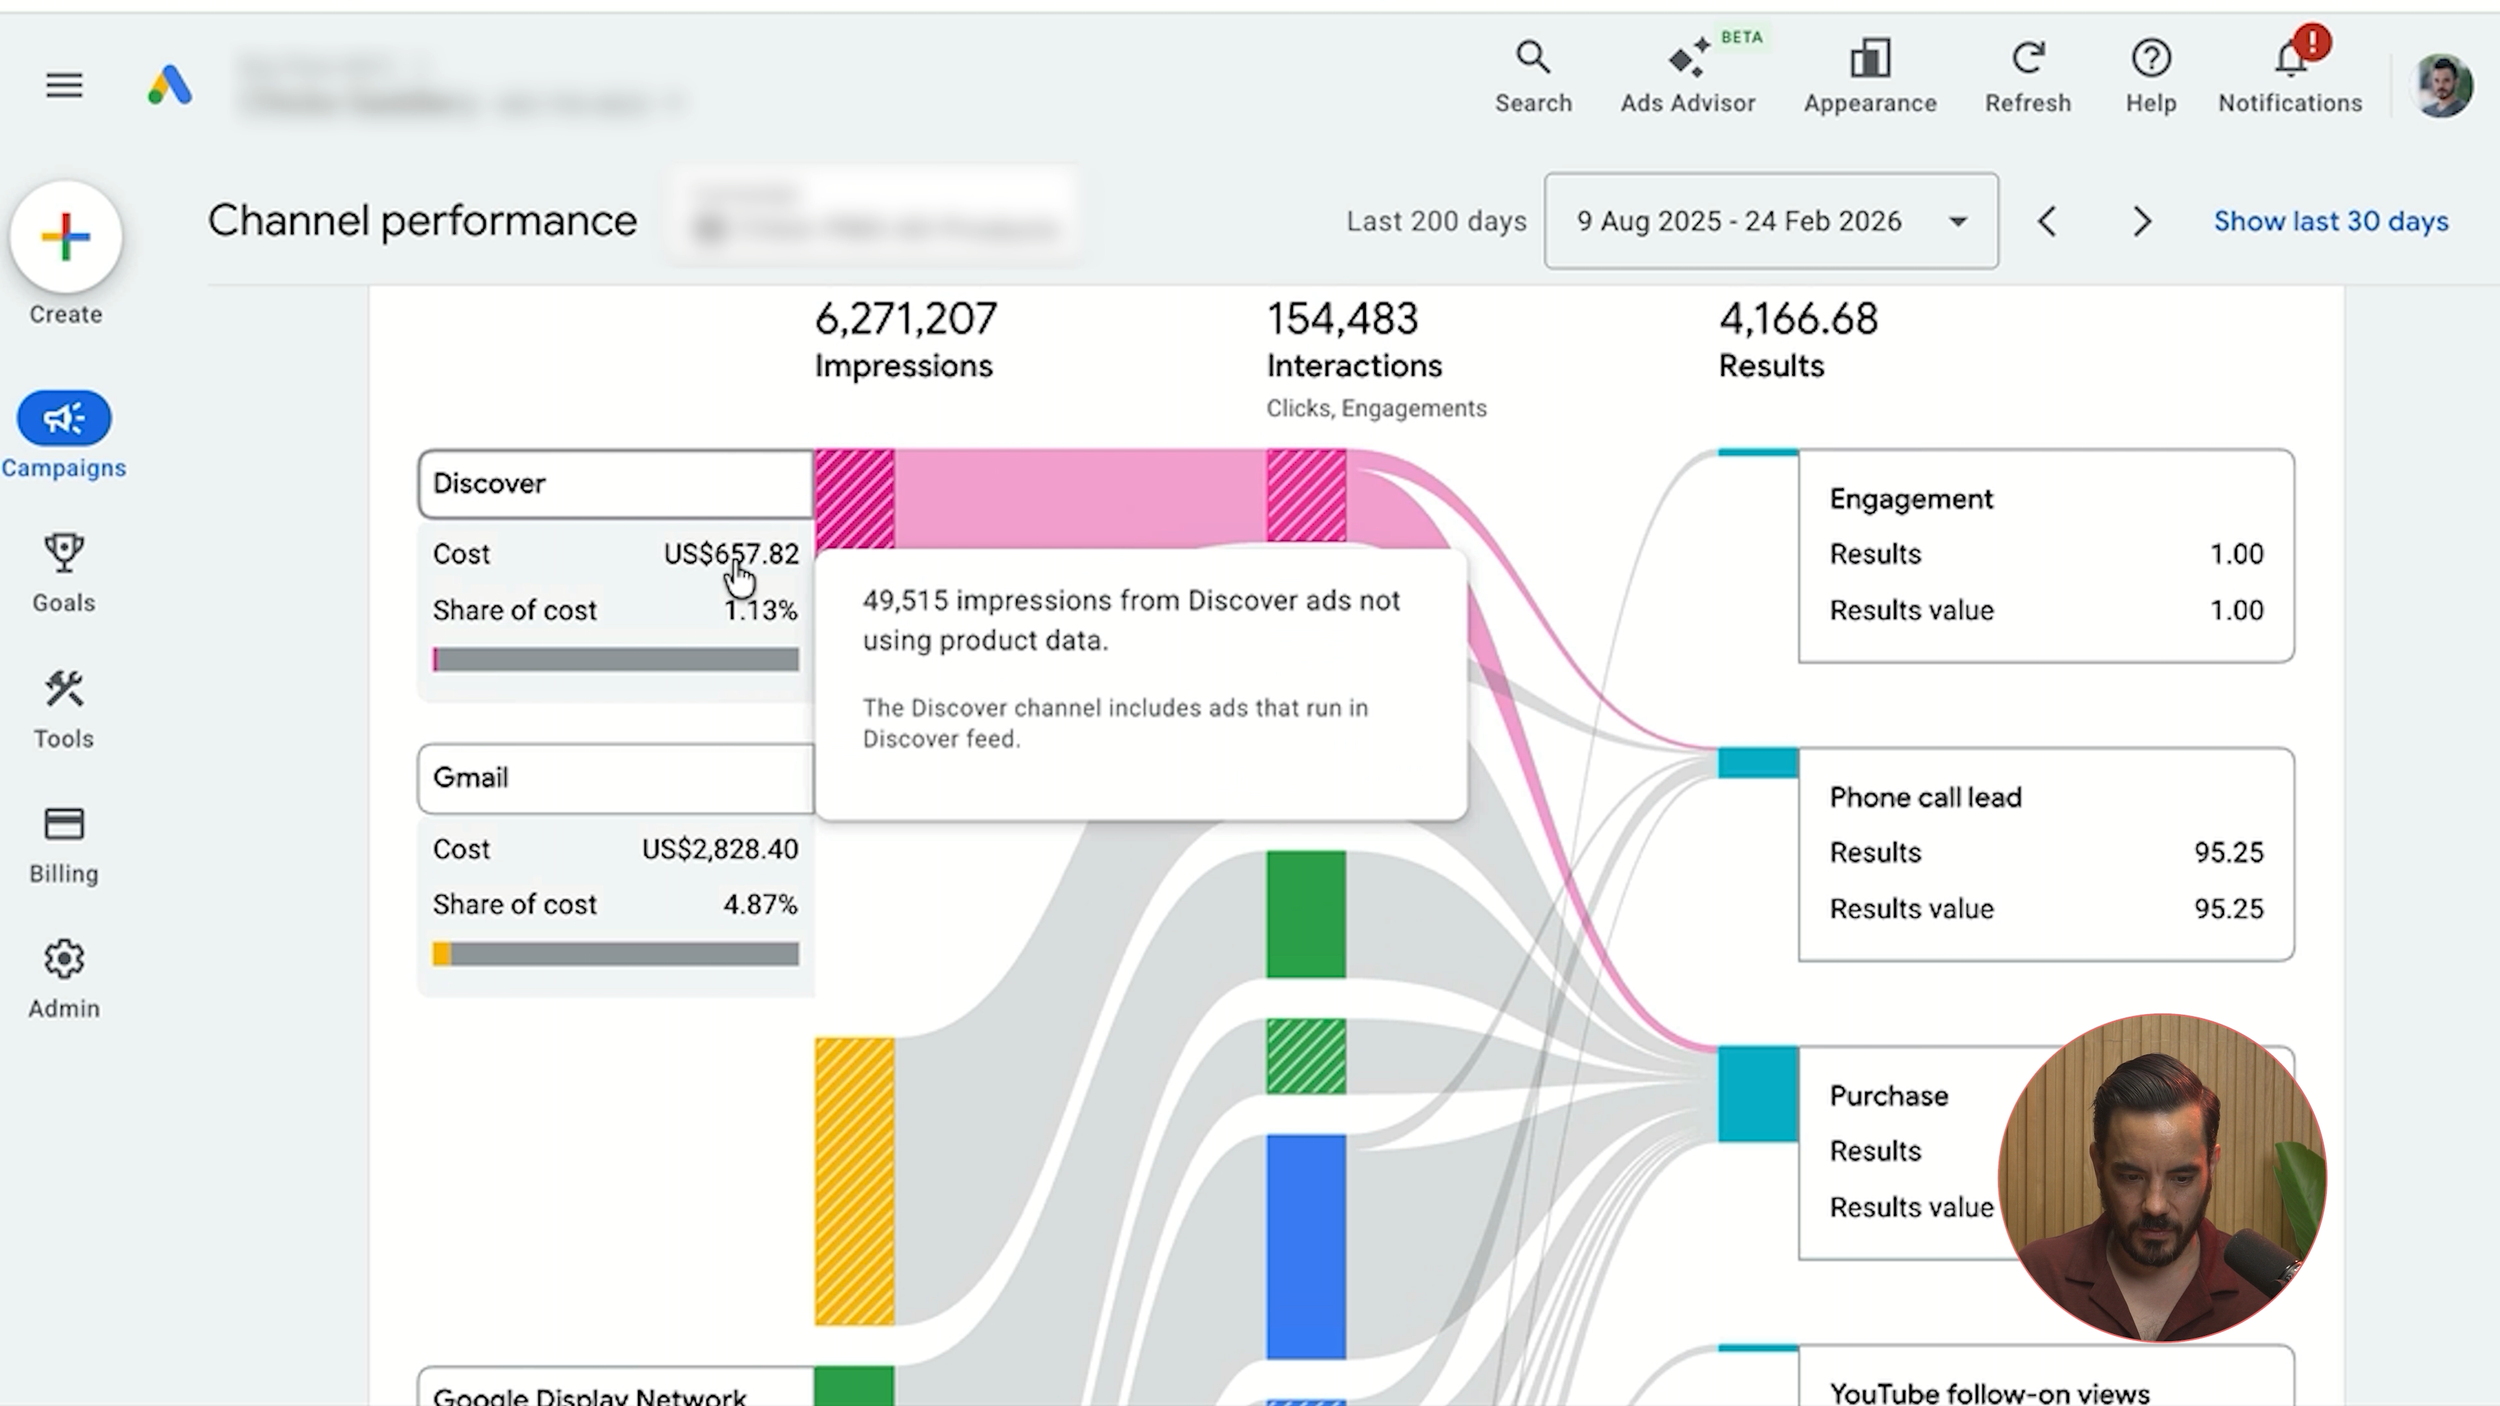
Below that, there's a fancy-looking flowchart visualisation. It shows you things like how much Discover spent and what actions resulted, but here's the problem: it doesn't show you cost per acquisition. It doesn't show you return on ad spend. It doesn't show you the metrics that actually matter to profit-driven ecommerce businesses. You might see that Discover drove some actions and some of those were purchases, but you have no idea how much revenue those generated.
Skip past it entirely. Scroll to the bottom. That's where the real data lives.
Customising Your Columns
The table at the bottom breaks out each channel: Discover, Gmail, Google Display Network, Google Search, Maps, Search Partners, and YouTube. But before this report becomes fully useful, you need to customise the column setup.
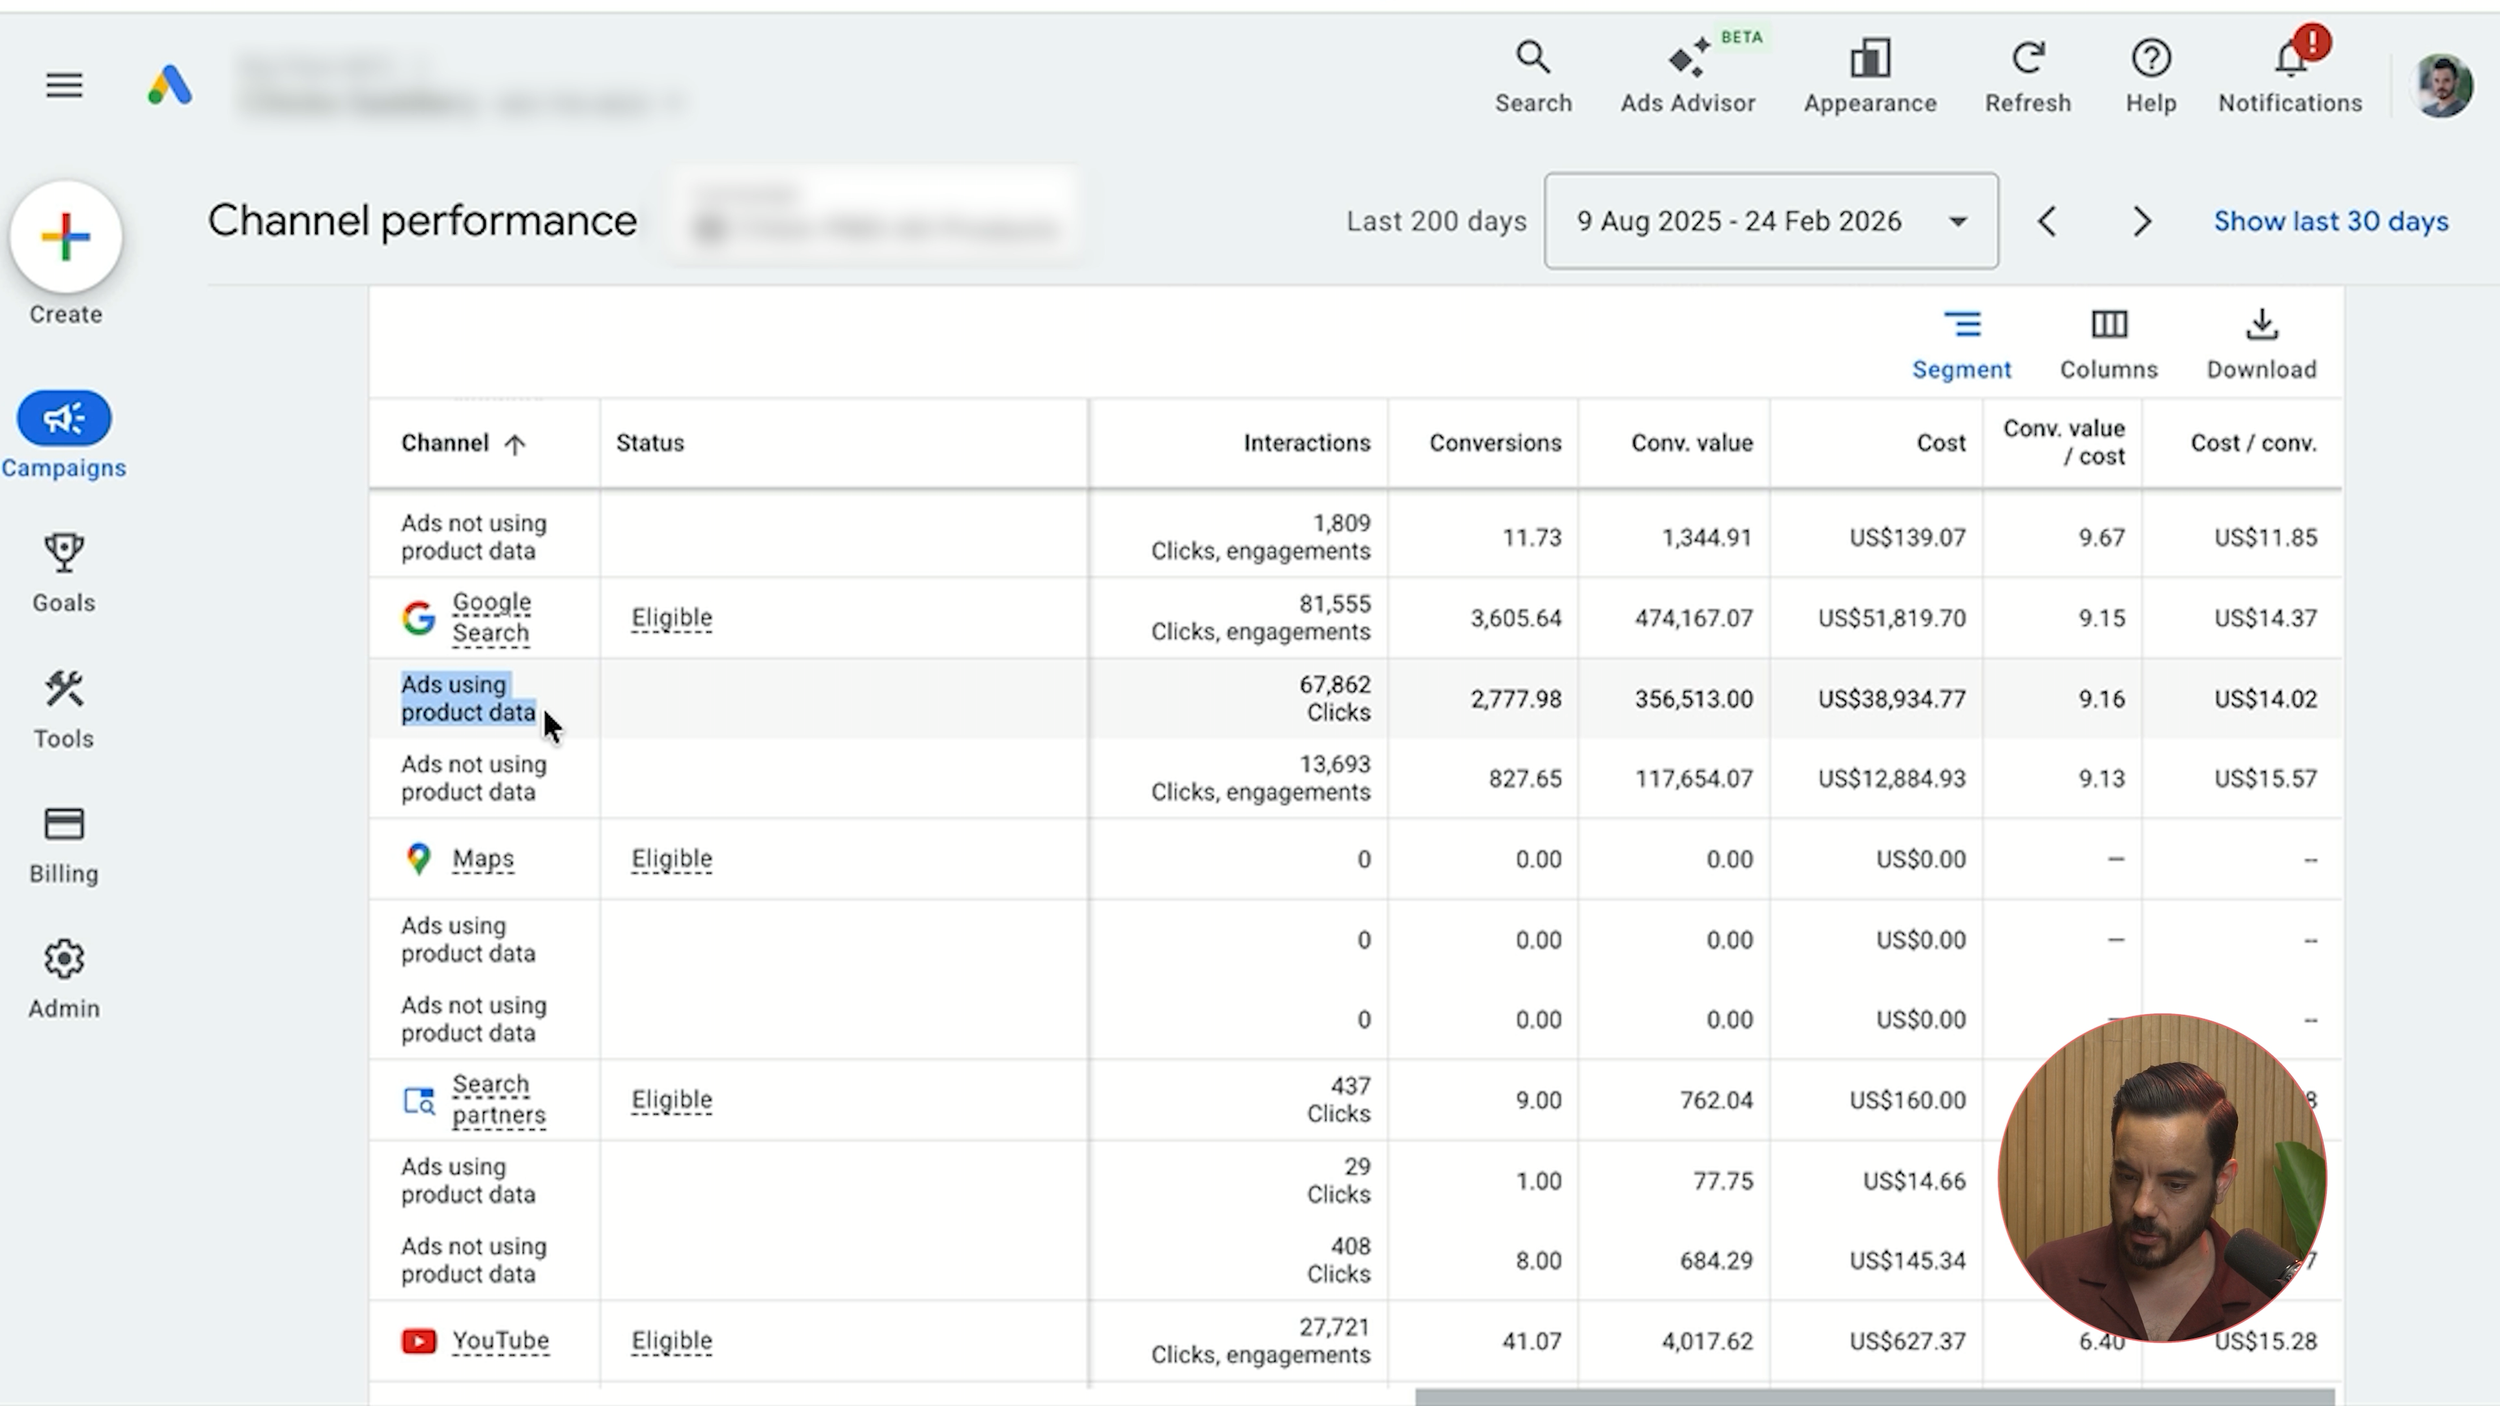
By default, you'll see columns for Results, Results Value, and Reports. These are useless for our purposes. Open up your column settings, remove those three, then navigate to the Conversions section and add the all-important ROAS and CPA columns.
This is what actually makes the report useful. Now you can see your ROAS per channel, cost per acquisition per channel, and spend amount per channel.
Understanding The Rows: Product Data vs Non-Product Data
Under each channel, you'll notice two sub-rows: Ads using product data and Ads not using product data.
This is critical to understand. "Ads using product data" means those ads are derived from your product feed sitting in Google Merchant Center. Pretty much every channel has some way of generating ads from your product feed, but the classic type is Shopping ads.
Here's something that catches people out: there is no separate row for Google Search text ads and Google Shopping ads. Google lumps them together under "Google Search." So to find your Shopping ads performance, you need to look at the sub-row under Google Search labelled "Ads using product data." That's Shopping.
This is the most important row in the entire report. It's the most important part of your PMax campaign. Most ecommerce stores are essentially using PMax as a type of Shopping campaign, so you want to see this row commanding the lion's share of the overall spend.
What A Healthy Spend Distribution Looks Like
For a well-optimised ecommerce PMax campaign, Shopping ads should account for roughly 65-80% of total campaign spend. Call it around 70% give or take.
The rest of the budget typically breaks down like this:
Search text ads: Around 10-15%
Display: A small slice, roughly 5-10%
Video (YouTube): Around 3-5%
Gmail, Discover, Maps: Minimal spend
If your distribution looks broadly like this, you've a healthy PMax campaign. Nothing to worry about from a spend distribution perspective.
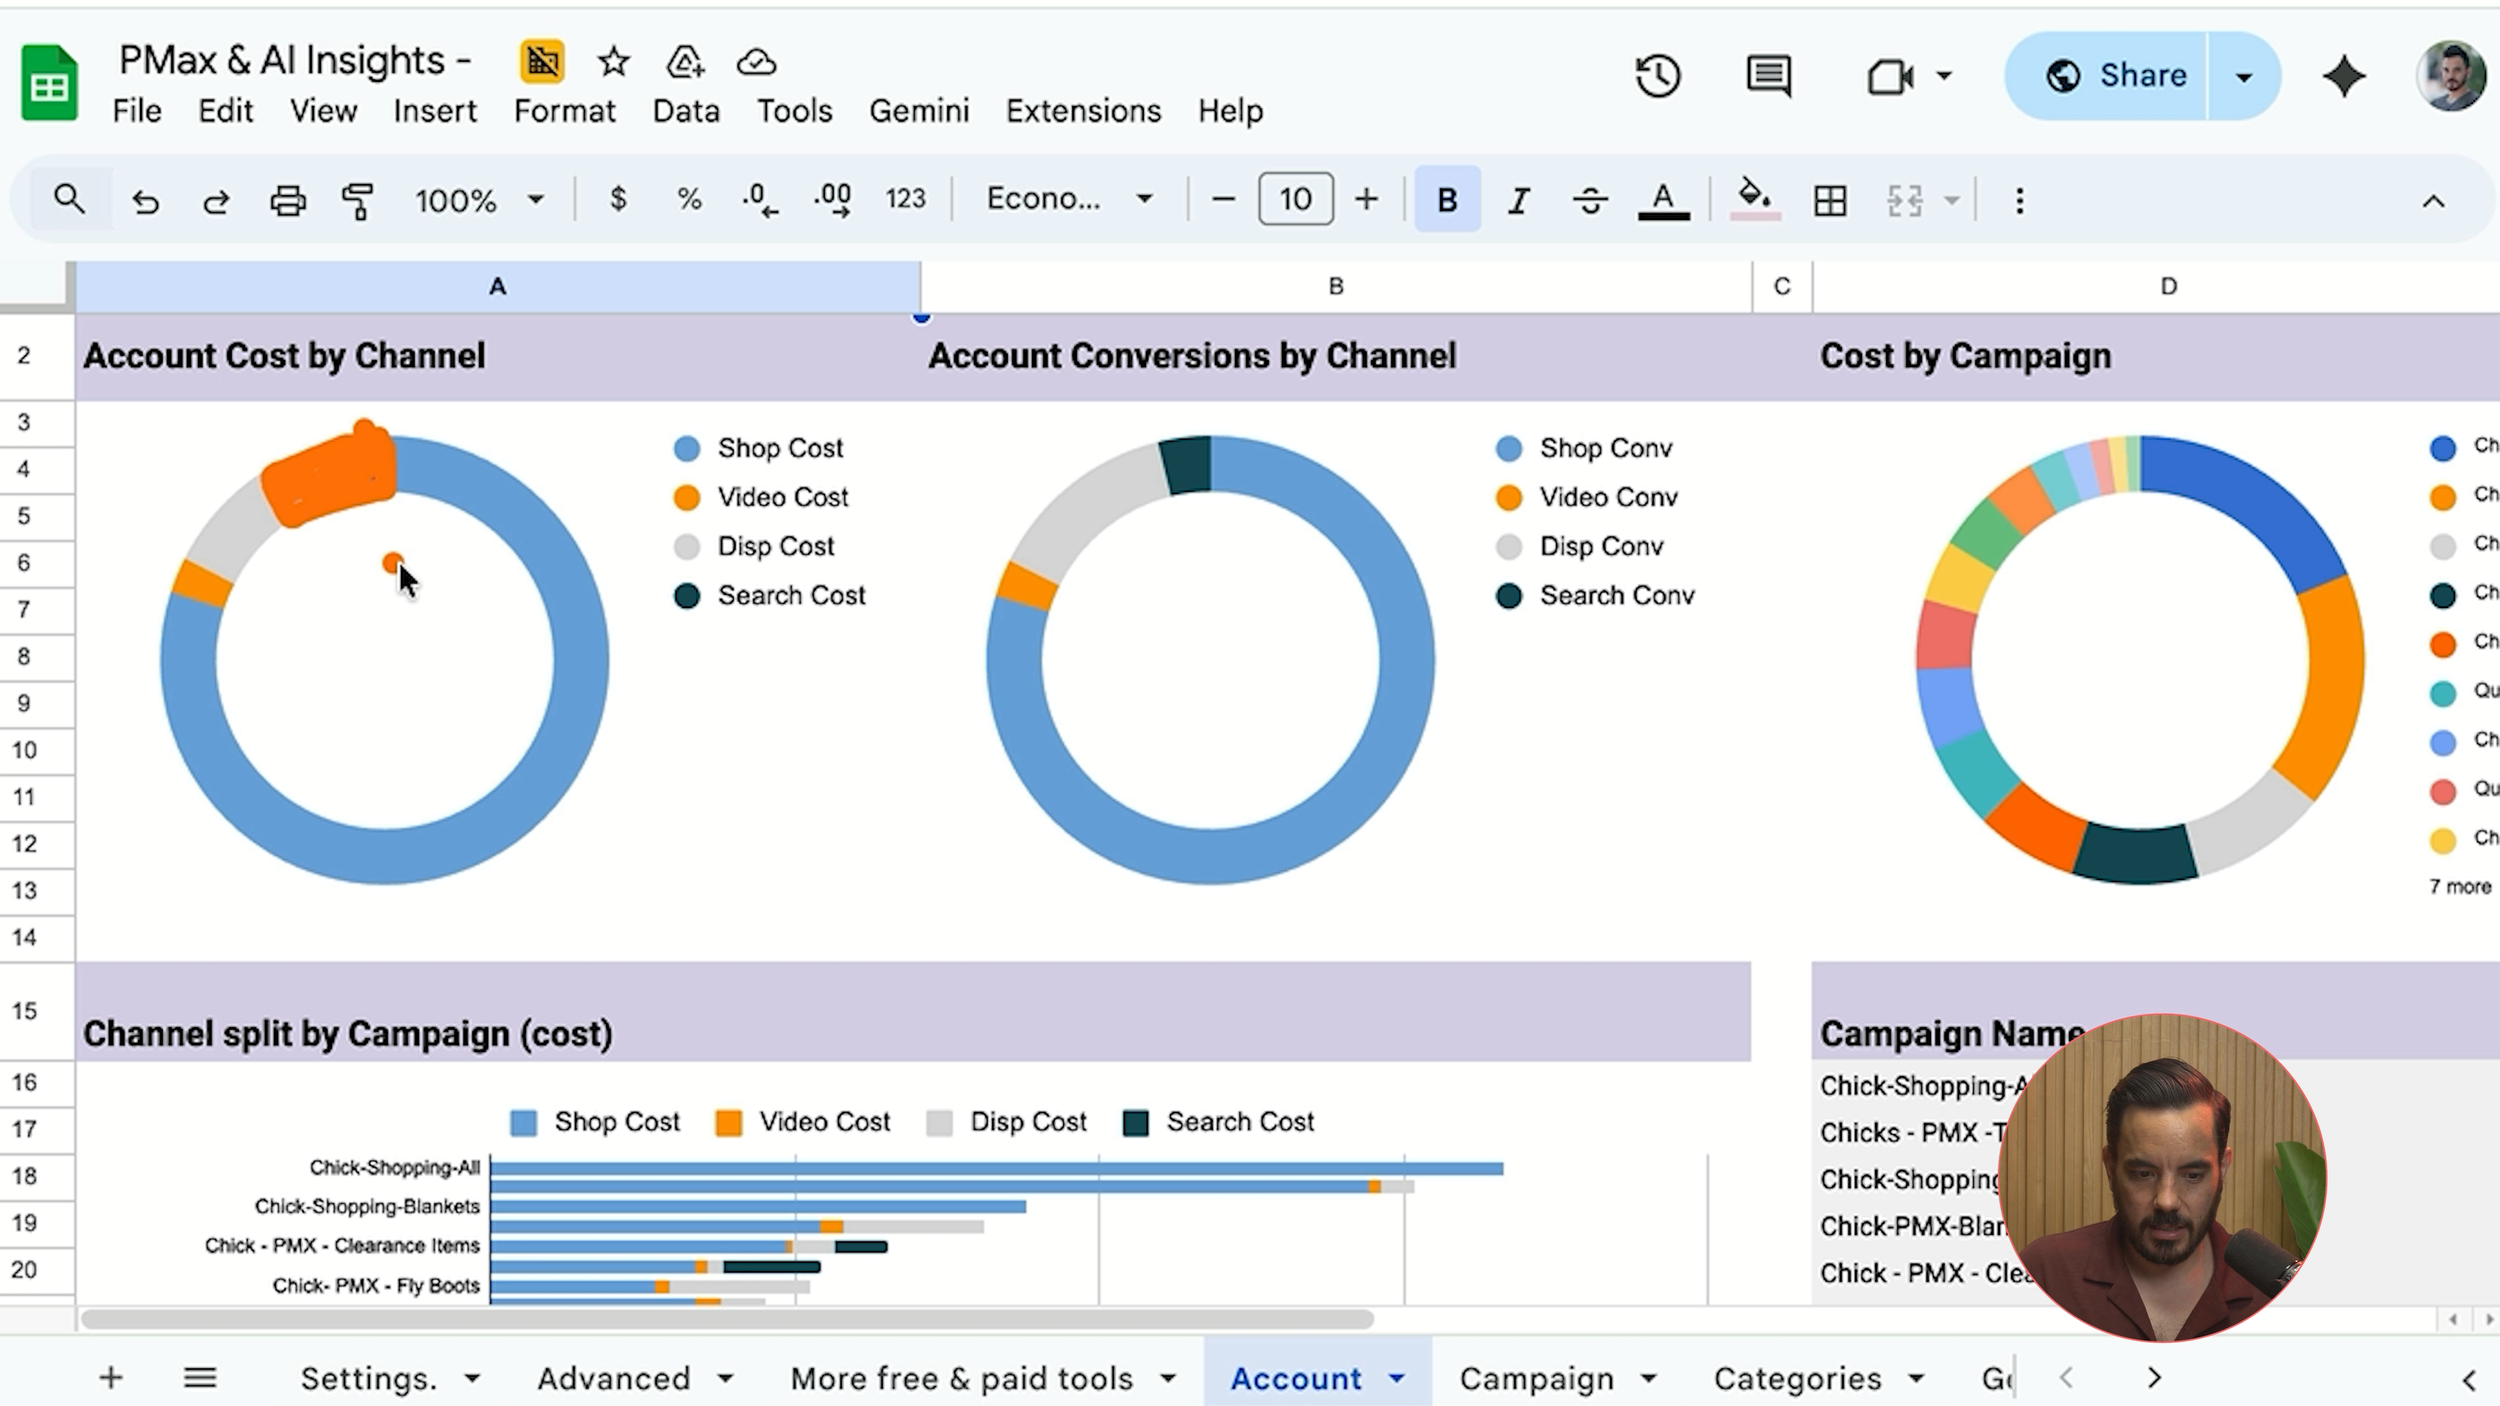
If you see something wildly different, like only 5% of spend on Shopping, or 50% on Video, or 100% on Display, then you know you've a problem that needs addressing.
What To Do With This Data: Three Common Scenarios
Scenario 1: A Non-Shopping Channel Is Performing Well
Say you look at your Channel Performance Report and you spot that Gmail or YouTube or Discover is spending a decent amount and delivering a strong ROAS. This is actually a good signal, and it presents an opportunity.
Inside PMax, you don't have the ability to control how much budget goes to each channel. But if a specific channel is performing well and you want to dedicate more budget to it, the move is to spin off a dedicated campaign type.
For anything other than Shopping or Search text ads, that means Demand Gen. Demand Gen campaigns can show ads on YouTube, Discover, Gmail, and the Google Display Network, and the great thing about Demand Gen is that you can specify exactly which channels you want to target. You can make it a Gmail-only campaign, a YouTube-only campaign, or any combination you like. PMax doesn't offer that level of control.
If you specifically want to work on your Search text ads performance (the "Ads not using product data" row under Google Search), then you'd spin off a dedicated Search campaign instead.
Scenario 2: A Non-Shopping Channel Has Low ROAS
Maybe Gmail is receiving decent spend but the ROAS is disappointing. You think you could improve it if you had more control over creative and targeting. Same approach: spin off a dedicated Demand Gen campaign where you can optimise those levers manually rather than letting PMax handle it automatically.
Scenario 3: Shopping Is The Only Thing Working
This is something that happens with somewhat regularity. You open the Channel Performance Report and Shopping ads is the only channel delivering a solid ROAS and decent spend. Everything else is rubbish. Display has spent a couple of thousand but is producing a horrible return. Gmail hasn't converted at all. YouTube is bleeding money.
If this is what you're seeing, the decision becomes clear: switch to Feed Only PMax.
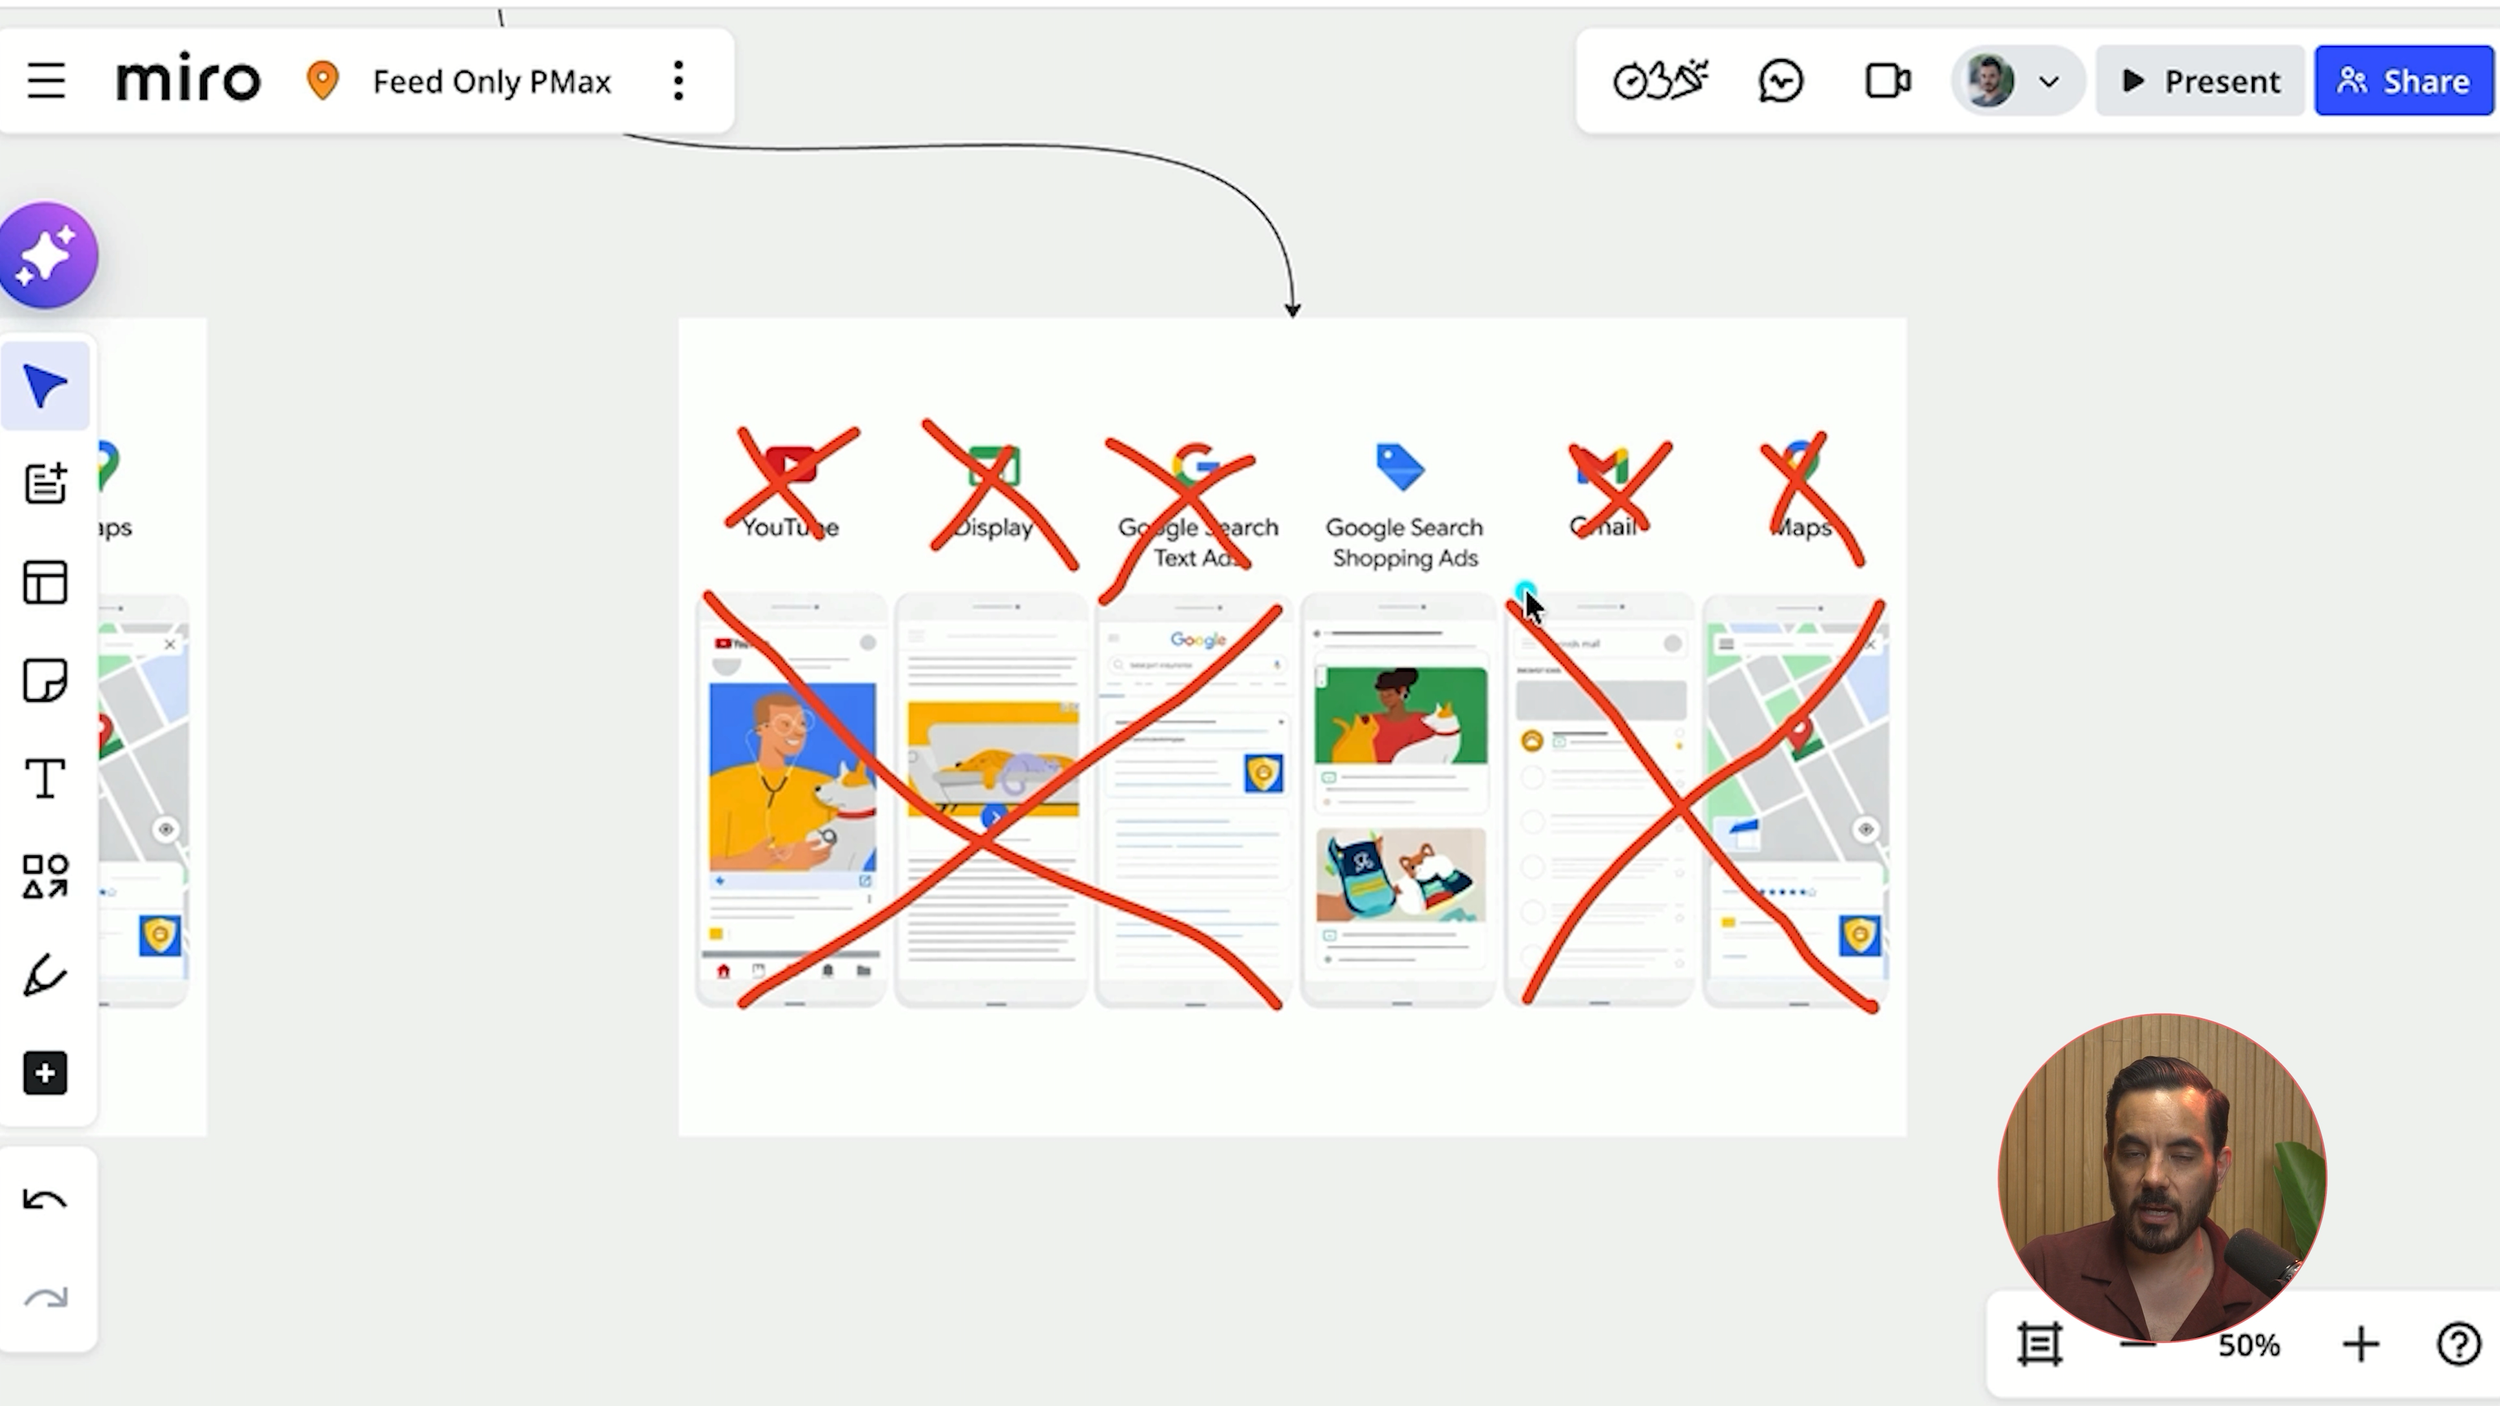
Feed Only PMax strips away all the non-Shopping channels and forces PMax to focus exclusively on Shopping ads. To make this switch, you remove all the creative assets from your asset group: delete the images, videos, headlines, and descriptions. Then go into your campaign settings and turn off auto asset generation.
This approach ensures that every penny of your PMax budget goes towards Shopping ads, which is where the vast majority of ecommerce revenue typically comes from anyway.
The Two Campaign Types You Can Spin Off
To summarise your options when the Channel Performance Report reveals something you want to act on:
Search campaigns - for working on Google Search text ads (the "not using product data" row)
Demand Gen campaigns - for working on YouTube, Discover, Gmail, or Google Display Network
And if none of the non-Shopping channels are pulling their weight, go Feed Only PMax and let Shopping do what it does best.
Conclusion
The Channel Performance Report is one of the most underused tools in Google Ads for ecommerce advertisers running PMax campaigns. To find it, click into any PMax campaign, navigate to Insights and Reports, and scroll down to Channel Performance. Skip the flowchart visualisation at the top and head straight to the data table at the bottom, making sure to customise your columns by adding ROAS and CPA. The most important row is Google Search "Ads using product data," which represents your Shopping ads, and this should account for roughly 65-80% of your total PMax spend. A healthy distribution puts the remainder across Search text ads (10-15%), Display (5-10%), and Video (3-5%). When you spot opportunities or problems in individual channels, you have three options: spin off a dedicated Demand Gen campaign for non-Search channels, spin off a Search campaign for text ads, or switch to Feed Only PMax if Shopping is the only channel performing. This report is your window into what PMax is actually doing with your money, and checking it regularly will help you make far smarter campaign decisions.