
Have you ever looked at your Google Ads results over the past few days and thought:
“Blimey, what happened to my conversions?”
I’ve been there. You spot a sudden drop in conversions, panic a little, and start wondering whether it’s time to shake things up in your account.
But here’s the thing...
That drop? It might not even be real.
Before you go tweaking bids, killing creatives, or nuking entire campaigns, you need to understand a little-known reporting trap inside Google Ads… and how to escape it.
Most Advertisers Are Looking at the Wrong Columns
By default, Google Ads reports conversions in a way that can severely undercount your performance, especially over the past few days.
That’s because the standard columns (Conversions, Conversion Value, ROAS, etc.) use what’s called “ad click date attribution”. Which means they date the conversion back to the day of the ad click, not the day the sale actually happened.
Sounds innocent, right?
Well… it’s not. Especially if your product has any sort of buying delay or consideration window.
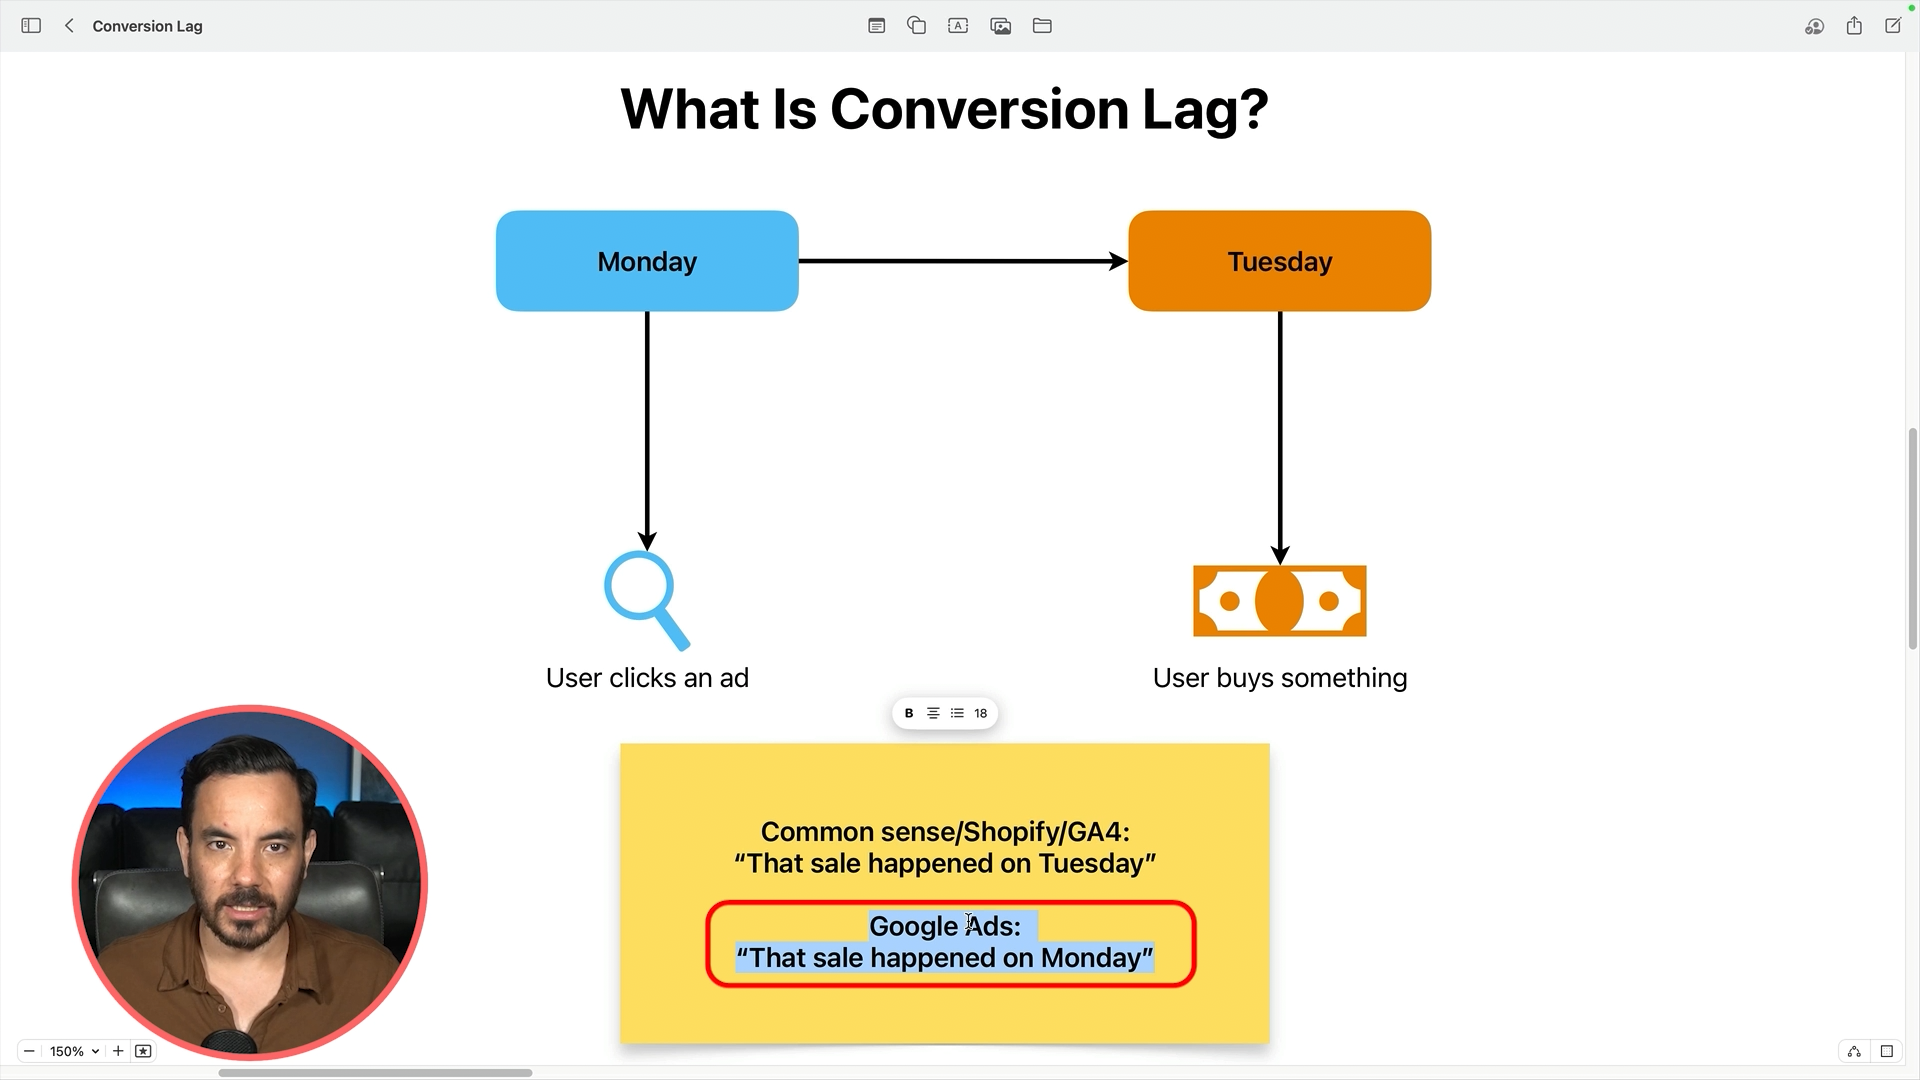
Example:
A shopper clicks your ad on Monday. They don’t buy right away. On Tuesday, they return directly to your site directly (no ad click) and finally place an order.
Shopify or GA4 will say: “That’s a Tuesday sale.”
But Google Ads will say: “Nope. That sale happened on Monday.”
Which means if you look at Tuesday in your Google Ads account, it will look like nothing happened… when in fact, you did just fine.
This is what’s known as conversion lag.
And if you don’t know how to account for it, you’ll always feel like your performance is worse than it really is, particularly when reviewing the last 1-7 days.
Fixing It: Use the “By Time” Columns
Here’s what I want you to do next time you check performance:
Step 1: Add These Columns
In Google Ads:
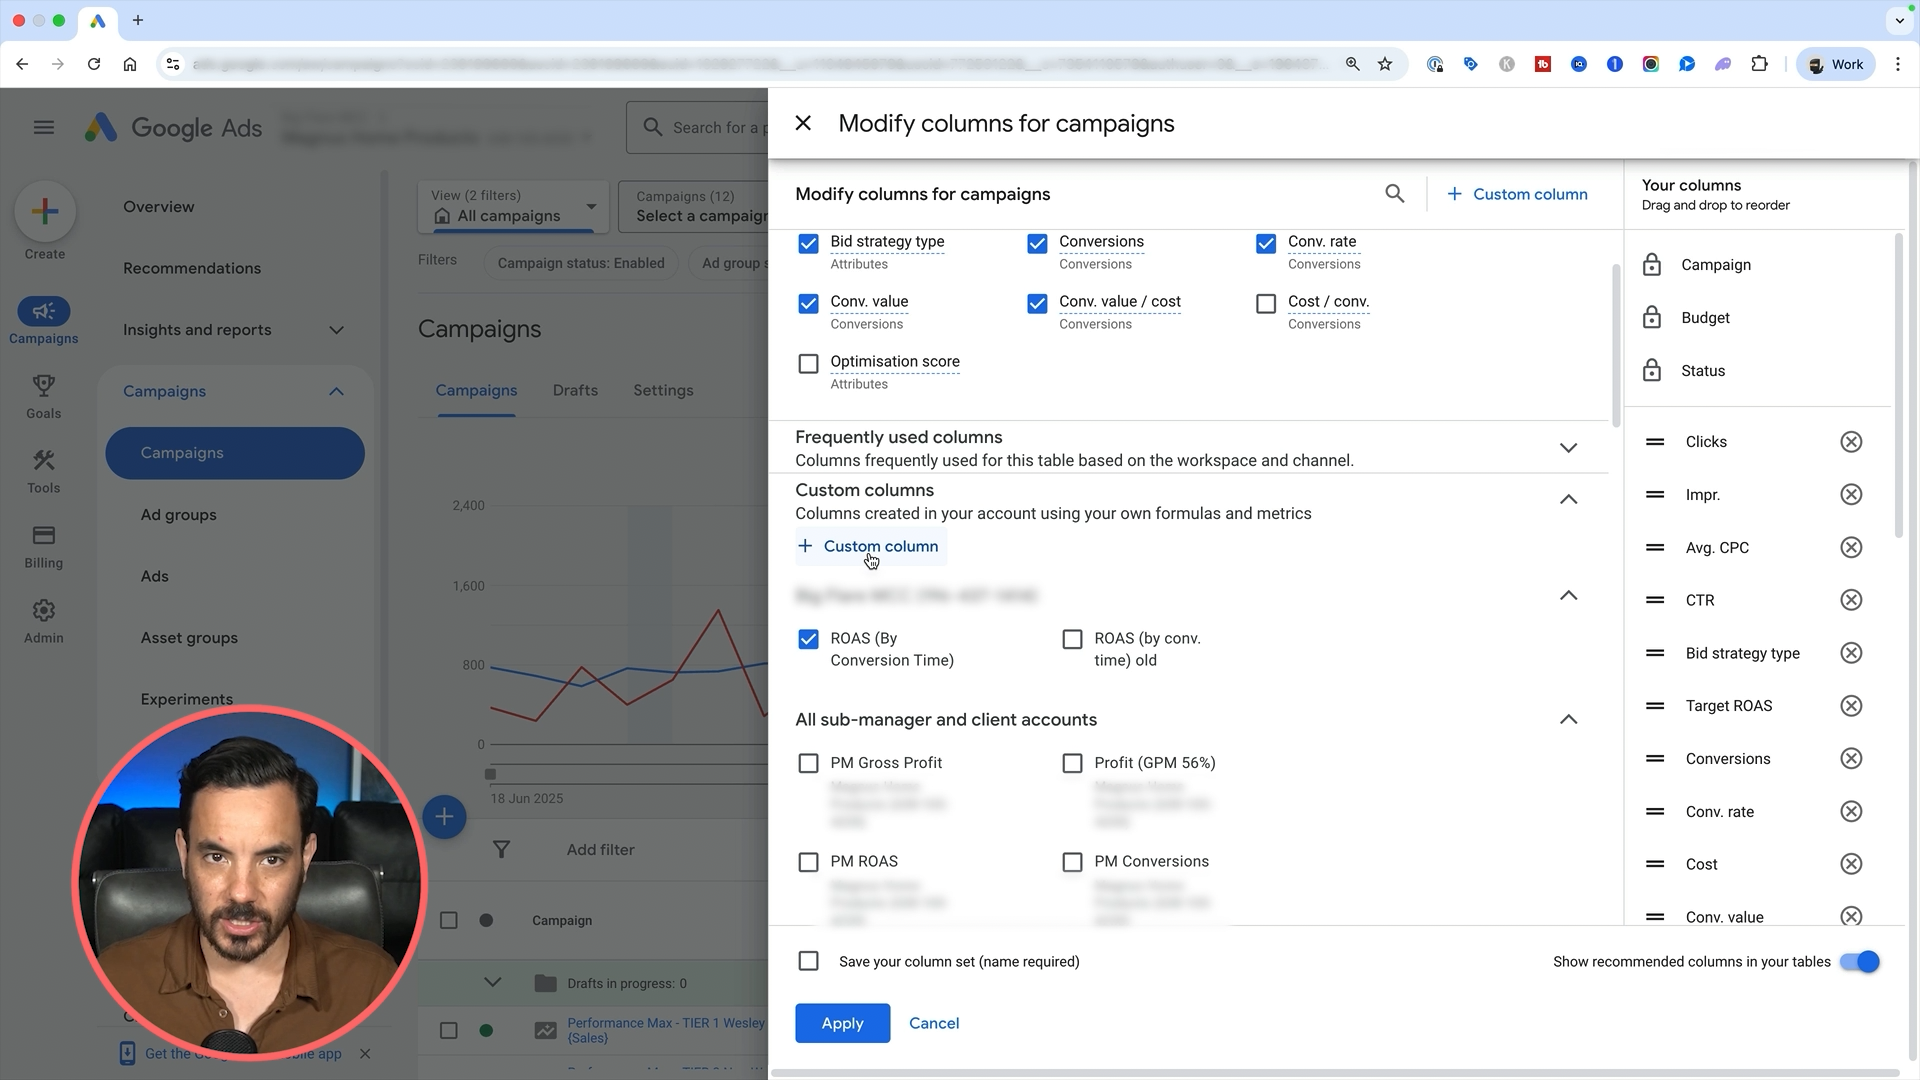
Go to Columns > Modify Columns.
Under Conversions, tick:
Conversions (by conv. time).
Conversion value (by conv. time).
These will report conversions based on when they actually occurred, like Shopify and GA4 do.
Step 2: Create a Custom Metric
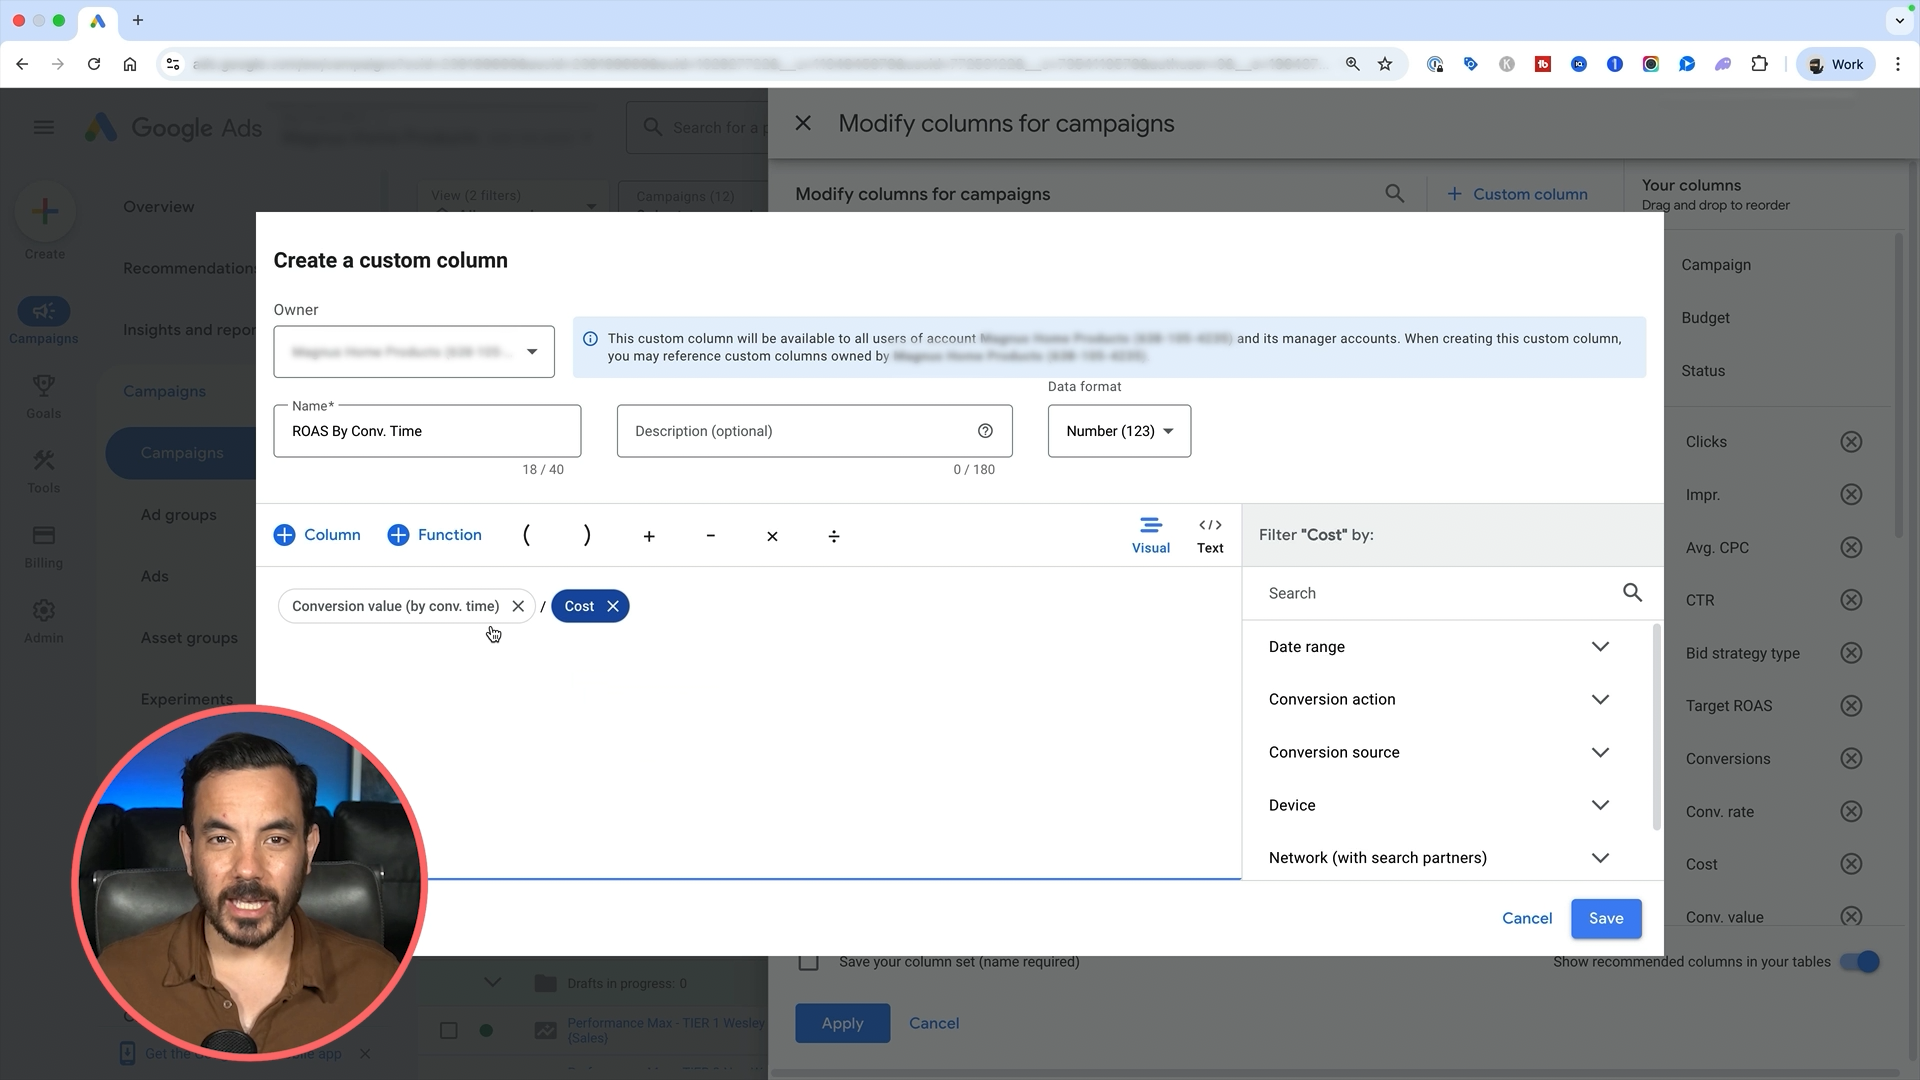
If you’re in ecommerce, you’ll want to create a custom ROAS by conversion time column:
Name: ROAS by conv. time.
Formula: Conversion value (by conv. time) / Cost.
If you’re lead gen, create a CPA by conversion time column instead:
Name: CPA by conv. time.
Formula: Cost / Conversions (by conv. time).
Now line these new columns up right next to your standard ones. Compare recent performance, say, the last 3 days.
You might be shocked.
In many accounts I’ve reviewed, the "by time" numbers are 20-40% higher than the default ones for recent days.
That’s 40% of revenue and performance that was already there, they’re just hidden from you by default reporting.
How Big Is Your Conversion Lag?
Every business has conversion lag, even if you’re selling cheap, low-consideration products.
But if you’re selling something expensive or high-consideration (think luxury mattresses, jewellery, custom products), the lag gets longer.
Typical Examples:
Low consideration product: 90% of sales happen same-day, 10% happen later.
High consideration product: Only 60% of sales happen same-day. Up to 40% happen 12+ days later.
So if you only ever look at the last 3–7 days in your account using standard conversion metrics… well, you’re flying blind.
How to Check Your Actual Lag:
Go here in Google Ads:
Tools & Settings > Measurement > Attribution.
Set a long date range (last 90 days).
Click into Path Metrics.
Review the Day Analysis report.
You’ll see exactly how many of your conversions come in the same-day, +1 day, +2 days, all the way to 12+ days.
I recently saw an ecommerce account with 30% of revenue happening more than a day after the click, and 8% taking more than 12 days.
In cases like that, if you're analysing anything less than 2 weeks old using standard columns, you’ll always underreport.
So When Should You Use Each Metric?
Great question. Here are my guidelines:
Use standard conversion columns for:
Making campaign optimisation decisions.
Understanding what Google Ads caused and when.
Analysing the impact of past changes or experiments.
Use “by time” conversion columns for:
Checking very recent performance (within the last 7–14 days).
Comparing against Shopify, GA4, or other platforms.
Setting expectations for lagged results.
They serve different purposes and using the wrong one at the wrong time can send you in the wrong direction.
TL;DR
If you’re seeing poor performance in the past few days in Google Ads, check the “by time” columns before you panic.
They’ll show you the real numbers and they often tell a much better story.
Then, use the Attribution report to understand your actual conversion lag.
And finally, don’t ditch the standard columns. Just know when and why to use each view.
To truly understand your Google Ads performance, you need to account for conversion lag and know when to use “standard” vs “by time” metrics. The default columns often underreport recent conversions, leading you to believe your campaigns are underperforming — when they might not be. By checking the right columns, building custom ROAS or CPA formulas, and reviewing the Attribution Path Metrics report, you can stop making knee-jerk decisions and start optimising with confidence.