

If you are reading this then you probably have a PPC campaign you are running or about to launch and are wondering, "what is a good benchmark CTR for my campaign?" Well, worry not, dear reader, I've got you covered with a look at benchmark CTRs by channel and an analysis of what constitutes a "good" CTR in 2018.
What is CTR?
First thing's first, we need to make sure we're agreed on what we're actually talking about when we are discussing your Click Through Rate (CTR). Most readers interested in this question are probably already running or about to run a digital marketing campaign, and it could be on Search, Social, Display, Email, Affiliate or a bunch of other examples. Today we'll be focusing on CTRs for Search, Facebook Ads, and Display as those are the most commonly sought examples, but the definition of CTR holds true for all channels:
Click Through Rate is the number of clicks your ad received, divided by the number of impressions it received.
It's important to note here that we said impressions not views. A view is when someone actually sees your ad, whereas an impression is when your ad was loaded on a user's browser screen. The two are not actually the same. For example, if a user searched for something on Google, and your ad loaded at the bottom of the page and the user did not even scroll down that far, you would have had 1 ad impression but 0 ad views.
Of course, using ad views instead of impressions would be a lot more useful. But, this metric is much harder to measure and does not have a standardised methodology across different ad channels. For example, an ad view on YouTube is counted when a user watches at least 30 seconds of your video, or the entirety of the video if it is shorter than 30 seconds. Facebook, on the other hand, counts a view whenever a user watches just 3 seconds of your video.
Because of differing definitions of what a "view" is, it just makes more sense as an industry that we standardise the definition of CTR based on clicks per impressions, as no one really disagrees over what an impression is.
Different Channels, Different Results
The "what is a good CTR" question is not very straightforward to answer, because we have a bunch of different channels (Search, Paid Social, Display, etc), a bunch of different industries, and a bunch of different placements within our channels and all of these affect the CTR. For example, we'd probably expect a higher CTR on a Search vs a Display campaign, and then within Display we'd probably expect a higher CTR on retargeted vs cold traffic. So we'll look at some broad averages by channel here, as these should be enough to give you an idea if you are heading in the correct direction. We'll also focus on the three areas that we think are most relevant for Ecommerce companies in 2018: Paid Search on Adwords, Display ads, and Facebook Ads.
What's a Good CTR for Paid Search?
When we're talking about Paid Search we are usually talking about Google (as they have around 90% share of the Search market, give or take, depending on what country you are in) and we are talking about the paid listings which normally pop up above the organic listings when you are searching for a "commercial" keyword (e.g. any keyword that implies an intent to whip out your credit card, some point down the line!). Here's what a Paid Search ad looks like in 2018:

Research carried out by Wordstream found that the average CTR on Google Adwords across all industries was 3.17%. This would suggest that if your account CTR is higher than about 3.2%, you're probably doing well. Just a few years ago, when Wordstream originally carried out this research, the all-industries average was much lower, at around 1.91%. The increase in average CTRs is testament to Google's continuous optimisation and improvement of its Search Engine Results Pages (SERPs). In recent years they've gotten rid of the ads on the side bar and moved more ads into the top of the page. Nowadays on lots of commercial-intent keywords, ads are covering most of the top of the page! So, an increase in CTRs is no surprise really, and the cynics in the industry would probably hasten to point out that Google is just getting better and better at lining their pockets.
To get a better idea of the changing look of Google SERPs, check this out:

In 2015 the SERPs had around 2 ads at the top and a bunch on the side, with the bottom half of the top of the first page being organic listings. Flash forward to 2018 on the right above, and the organic listings have gone entirely! Ads take up almost all of the top of the first page, organic listings have been pushed far down enough that you actually have to scroll to see them, and (for this particular type of search about "cheap flights") Google's own product, Google Flights, has a slightly increased size.
With this in mind, it's no wonder that average CTRs for Adwords ads have almost doubled since 2015.
Our colleagues over at Wordstream had some further data to share, this time breaking out the Paid Search CTRs by industry:

According to the above data, the strongest CTRs were enjoyed by the Dating & Personals and Travel & Hospitality industries, scoring 6.05% and 4.68& CTRs respectively. Meanwhile the bottom tier industries, by CTR, were Technology with 2.09% and B2B and Consumer Services, both of which were tied at 2.41%.
What's a Good CTR for Display Advertising?
Display (AKA banner) advertising is an entirely different kettle of fish to Paid Search. Whereas in Paid Search, ads are shown only to users searching specifically for the relevant keywords that were targeted, with Display advertising banner ads can be splashed across third party websites whether or not the user was in a frame of mind to be looking for that product. As you'd expect, the difference in mindset and placement results in very different CTR results.
Here's what a typical display ad looks like in 2018:

Google has released monthly display advertising CTR benchmarks up until April 2017 over at their Rich Media Gallery site. It's a pretty useful resource gathering data from across Google's huge Display Network, one of the largest if not the largest display network available. It's unfortunate that they stopped publishing data on display CTRs here since April 2017, but based on the data we do have in there here are the display CTR benchmarks for April 2016 to April 2017:
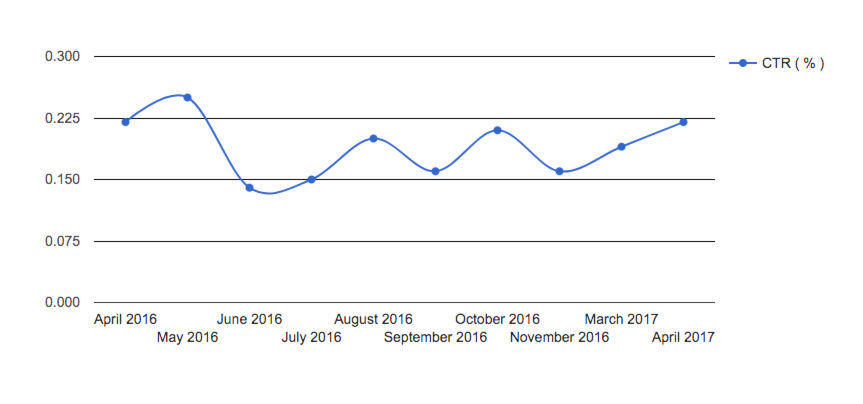
According to Google's data, a good CTR for display through 2016 up until April 2017 would have been somewhere above 0.15% to 0.25%. I'd say that even today, those benchmarks hold true. Display advertising has no central controlling body and has not changed as much as the Google SERPs have, as a result I expect that if we had good data on today's Display CTR benchmarks we'd see they are largely the same as they were in 2017. Based on the clients we work with, I'd say that anything above a 0.20% CTR for Display would be good by today's standards (although I'd expect higher if we were talking just about retargeting).
If we aggregate all the data from the above period of April 2016 - April 2017, we see that the average CTR for all of Display for that year was 0.19%:

Interestingly enough, Standard Display ads had a much higher CTR than did Rich Media ones, with 0.42% and 0.13% respectively. Often, advertisers will prefer Rich Media ads because of all the fancy options and animations available. It really can look a lot more slick than standard display ads. But, as the data here shows, it usually works out a lot less effective than boring old "standard" format ads. Let this be a lesson to you!
Facebook Ads CTR Benchmarks
Wordstream have conducted research on Facebook ads average CTRs and come up with the below data by industry.

According to their data gathered from users of their tool, the highest CTRs were had in the Legal industry. We found this particular result quite surprising. When was the last time you saw an ad for a legal service on Facebook? Also, Facebook Ads tend to work best, in our experience, for products and services with a highly visual component, ideally something that looks appealing and unique, because so much of the performance of a Facebook Ad is based on its image. Nevertheless, the data don't lie, and Legal is the chart topping industry on Facebook Ads, as far as CTRs are concerned.
Average CTRs across all industries on Facebook were 0.90%. This seems to agree with our own experience running Facebook Ads, where we tend to aim for 1% and above when it comes to CTR. Experience has shown this to be a good starting benchmark. Of course, the placement on Facebook matters, with desktop newsfeed and mobile newsfeed ads getting much higher CTRs than sidebar ads.
Conclusion
And there you have it, a full breakdown of what constitutes a good and an average CTR across Search, Display and Facebook Ads in 2018. Now that you are armed with this data you should start putting it to work in your own campaigns. Using this data you will be able to identify areas you should be prioritising for improvements and areas that are doing OK. For example, if you are running a Facebook ads campaign that's doing a 1.5% CTR, and an Adwords campaign that's doing a 2.5%, and you want to improve CTR somewhere, your initial reaction might be to work on Facebook as it has the lower CTR. However, now you know that actually, 1.5% CTR on Facebook is above average, and your Adwords CTR of 2.5% is actually the one that is below average.