
Since its launch last year, Performance Max has felt like a total black box where you can’t see where your spend is going. To a degree this is true, but unlike some other automated campaigns on Google Ads there’s a trick that allows you to calculate exactly where PMax is actually spending your money.
Once you’ve learned this trick, you’ll be able to see exactly how much money PMax is spending on Shopping, Video and “Others” (so if Google is just wasting a tonne of money on Video instead of focusing on Shopping like you wanted it to, you’ll know).
If you’ve had a performance drop recently, you’ll be able to figure out if this was, for instance, due to PMax spending less on Shopping. You’ll also be able to see how this distribution changes over time, giving you a better clue as to where changes in your performance may be coming from. You never know when Google will shut the door on workarounds like this, so I’d suggest getting familiar with it ASAP.
The Hack
The whole reason this method works is because currently, if you have a video campaign live and if you review PMax data using the “All Campaigns” view (it doesn’t work if you filter into the “Performance Max” campaigns view on the left side bar), you will be able to see two important metrics for PMax - Video Views and Average CPV (Cost Per View).
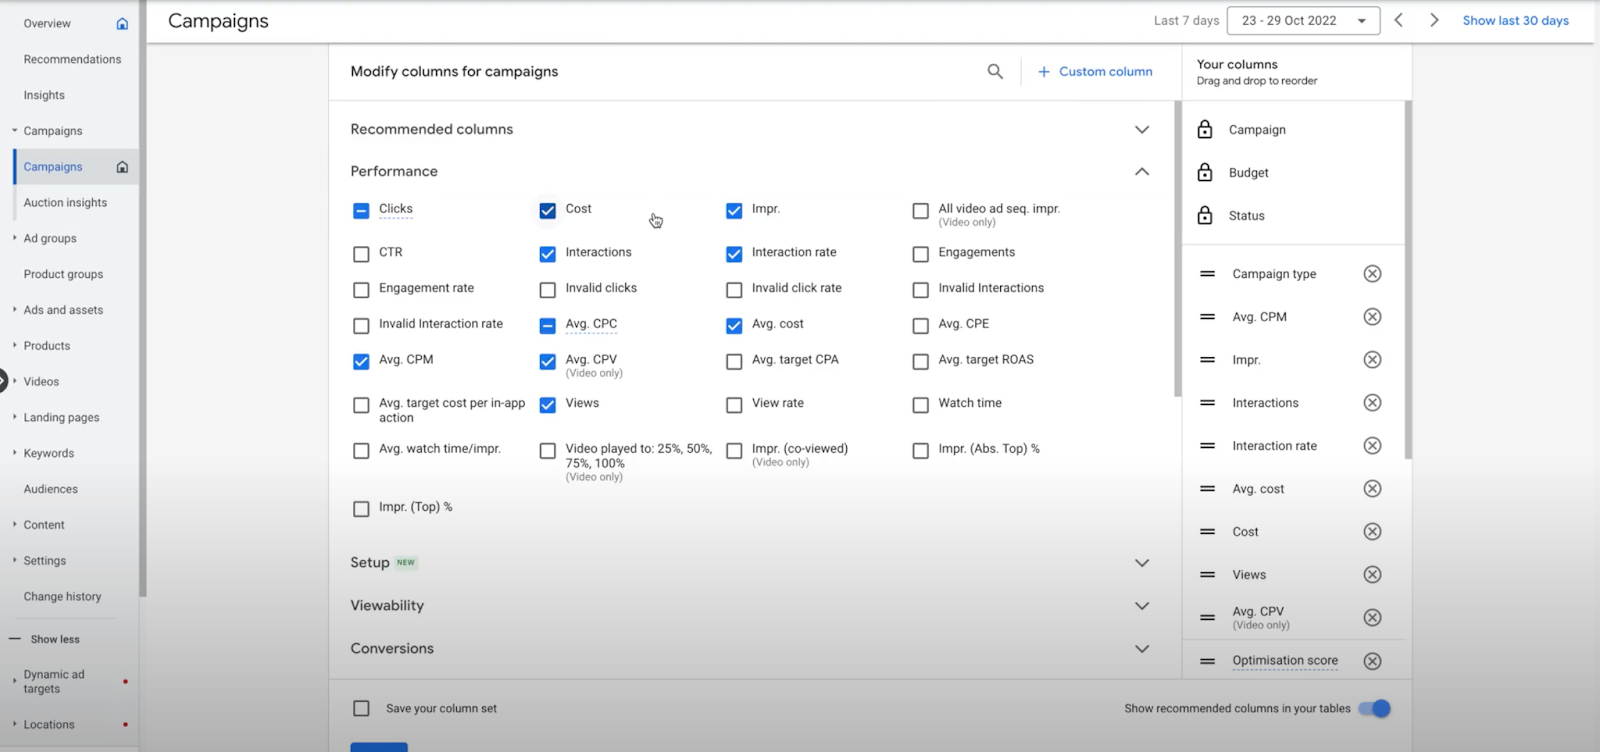
Start by going to the “All Campaigns” screen in Google Ads and make sure to add the columns for Video Views and Average CPV. If you already have a YouTube campaign in your account, these columns will appear. If you don’t, don’t sweat! You can actually create a dummy YouTube campaign. Just go through the campaign setup process for a YouTube campaign, but at the end leave the campaign in “paused” state.
Once you’ve done this, download the data from your Performance Max campaigns and open it as a spreadsheet to make the calculations a bit easier to do. You can do this by clicking the download button above your list of campaigns in the ‘All Campaigns’ screen and exporting as a CSV or Google Sheet. Remember to make sure you include video views and average CPV in your columns before you download. Your columns should look something like this:
Once you have the data in a spreadsheet, let’s start by working out the total we’ve spent on Performance Max campaigns so we can see spend from other networks as a percentage of that. You can do that by filtering to Performance Max under ‘Campaign Type’ or by expanding the ‘Total: Account’ row at the bottom of the page and looking at ‘Performance Max Campaigns’ there. Whack the total into your spreadsheet so we have it for later.
Now, here’s the trick for working out how much we’ve spent on Video campaigns. Although Google doesn’t explicitly tell us how much we’ve spent on Video placements, it does tell us how many video views it recorded and how much each one cost (that’s why we downloaded video views and CPV earlier). To work out the spend for Video ads, it’s as simple as taking the total number of video views and multiplying it by the average CPV. Now we’ve got our spend for Video, we can divide that by the total we’ve spent on the Performance Max campaign to give us the percentage that Google has served on video placements.
This is a good start, but how do we work out how much Google has spent on Shopping placements as well? Luckily, this is even easier if you know where to look. Go back into Google Ads and click on the Performance Max campaign you want to analyse. Once you’re on campaign level, click on ‘Listing Group’ on the menu on the right. At the top, you’ll see the cost for ‘All Products’, which is the total Shopping spend in that Performance Max campaign. If you have multiple asset groups, you will see multiple "all products" lines in grey which you will need to manually add up. This is where you can find the total we’re looking for:

Then, simply repeat the same process of dividing the Shopping spend by the total spend to give you the percentage that’s been spent on Shopping.
Great, but how does this help me?
Once you’ve worked out the spend on Video and Shopping, you can work out the remaining cost of “Others” in your spreadsheet, which will cover what’s been spent across Display, Search and Gmail. While we can’t calculate the exact split between Display, Search and Gmail currently, there are still some very useful insights to be drawn once we know the split between Video, Shopping and “Others”.
Let’s say that a large proportion of the campaign’s delivery has gone towards video when this used to only make up a small percentage of spend when you ran the campaigns manually. In this case, we can conclude that the video creative we’re running could probably be optimised given that Google’s identified high-intent users as being on this network. This is really helpful for knowing where to prioritise our time and resource. The same thinking goes for Shopping: if the majority of spend has gone here, I’d prioritise your time towards improving aspects of the Shopping feed such as the product titles and images.
Another powerful way to use this information is in analysing performance drops. If your PMax results have suddenly declined and you are scratching your head as to why, calculate where the spend was going before and after the change in performance. Did spend on video suddenly go up, or spend on Shopping suddenly came down, at the same time as your performance drop? Well, that there could be the culprit!